AAplot's Scalar Chart interface displays the complex impedance, impedance magnitude, SWR and Return Loss of a test load on a scalar chart.
The following figure shows the Scalar Chart interface displaying the complex impedance (R-X menu) plot.
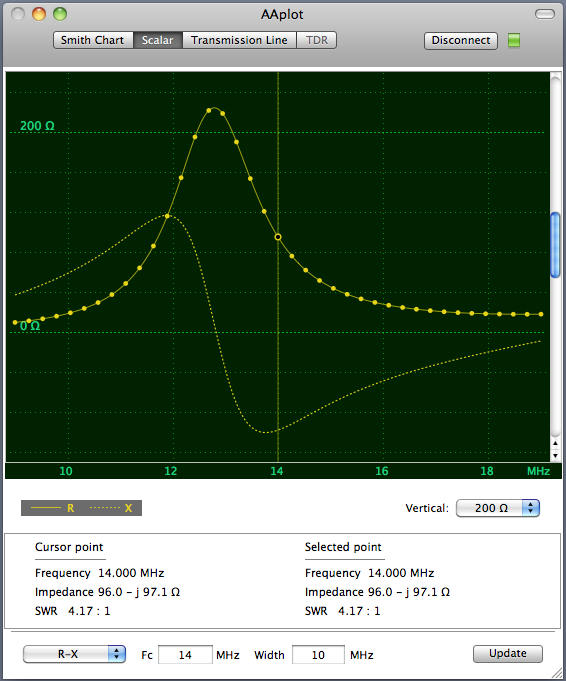
Like the Smith Chart interface, measured values are represented by yellow dots. The "selected point" is a donut shaped point. The actual data for the selected point is shown in the table at the bottom right. You can display the data for a different measured point by clicking on its dot (the donut will move to that point).
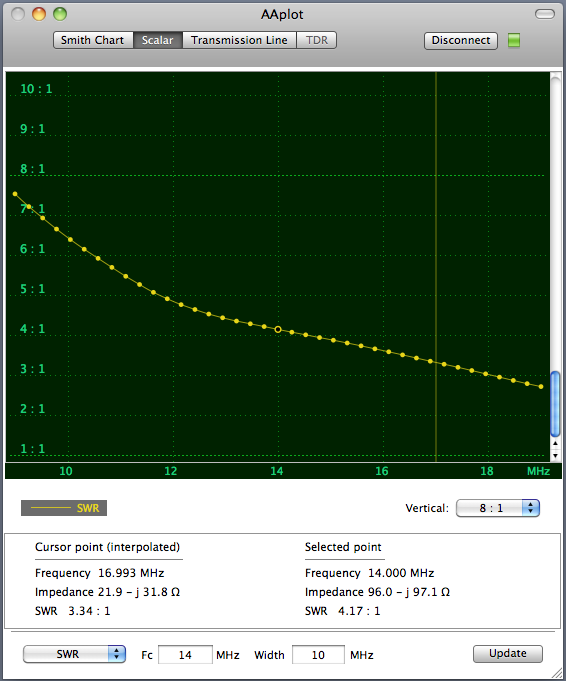
Each time you set a new selected point, a vertical yellow cursor will move to that point. If you hold down the mouse near the vertical cursor, you can drag the cursor towards the left or right of the chart. The table at the bottom left side of the chart will show the data that correspond to the cursor position. These are values that are interpolated from the measured points. The following figure shows the SWR chart , with the cursor dragged to 16.993 MHz:
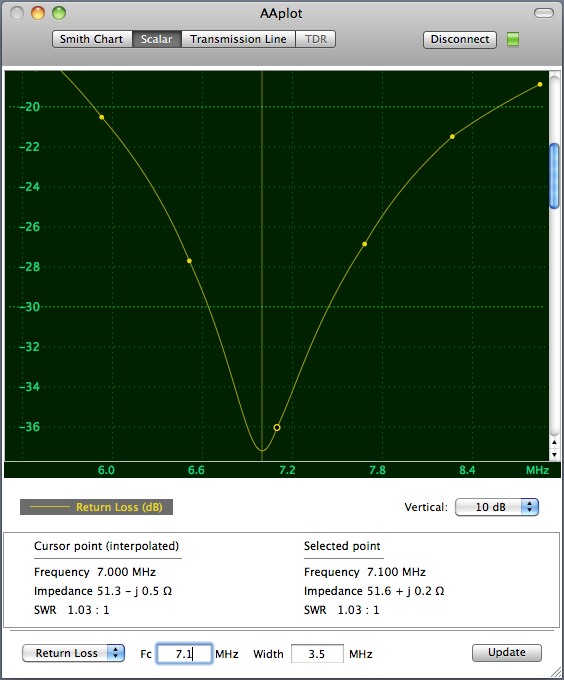
The vertical part of a scalar chart can be scrolled up and down, and the visible part of the vertical scale can be set by using the Vertical popup menu on the right, below the plot area.
The following shows the Return Loss plot for a series RLC circuit: