Kok Chen, W7AY
w7ay (at) arrl (dot) net
January 14, 2013
1. Introduction
We study the effects of transmit filtering on an Amateur
RTTY signal (Frequency Shift Keying, with data rate of
45.45 baud and FSK shift of 170 Hz).
Specifically, we show (i) the practical limit of how narrow
an RTTY transmit filter can be constructed, and (ii) some
representative plots of the amount of energy overlap there
is between the Mark and Space signals for various filters.
The former determines the extent we can help avoid causing
interference to an adjacent RTTY station, and the latter
can help determine the limit of how narrow a transmit
filter can be made when used in conjunction with an AFSK
transmitter that has high intermodulation distortion.
Prior works with RTTY transmit filtering include a study of
what a transmit filter does to a Matched Filter waveform
[reference 1] and a study of
interference from unfiltered RTTY signals during busy
RTTY activity [reference 2].
In section 2, we show how a transmit filter
affects the error rates from a demodulator that uses a
Raised Cosine filter.
When an RTTY signal is filtered, the Mark and Space
carriers will overlap temporally. When this overlapping
signal is passed through a practical AFSK transmitter, the
transmitter's intermodulation distortion (IMD) will cause
the spectrum of the filtered signal to widen. In section 3, we will discuss the dependency
of the overlap energy on the transmit filter bandwidth.
This information can be used to estimate the spectrum
widening when the transmit IMD characteristics are
known.
2. Transmit Filtering
When demodulated with an optimal Raised Cosine data filter,
the transmitted RTTY signal need not include any keying
sidebands that reaches beyond the response of the
receiver's Raised Cosine filter. A Raised Cosine (β=1) data
filter for an Amateur RTTY signal has a -6 dB point at
22.725 Hz and falls to zero beyond 45.45 Hz.
As a result, when used with a 170 Hz FSK shift, this
receiving filter will not respond to anything that extends
beyond a 261 Hz passband.
This implies that an ideal distortion free, ripple free,
brick wall transmit filter needs only be 261 Hz wide.
However, the skirt of a practical filter does not have
infinite slope, and the filter top is not completely flat,
so a practical filter will need to be somewhat wider than
261 Hz.
Additionally, if the filtering is performed with anything
other than a linear phase filter, we will also need to take
group delay into account. Filter group delay is not within
the scope of this discussion, since we shall assume that
digital signal processing (DSP) techniques are available in
the transmitter, or in the software that generates the AFSK
signal for the transmitter.
We shall use a Blackman windowed bandpass filter for our
purpose. The reason for choosing a Blackman window is that
while the filter skirt is relatively shallow (compared to
the Hann window, for example) down to about -20 dB, the
skirts fall very steeply beyond that. This will help keep
the transmit signal from adversely affecting a nearby
signal that is more than 50 dB weaker (about 8 "S" units).
Figure 2.1 shows the frequency response of a Blackman
windowed bandpass filter whose -6 dB bandwidth is 280 Hz
wide (we will see later why we choose 280 Hz). The FIR
filter has 8192 taps with a sampling rate of 48000
samples/sec.
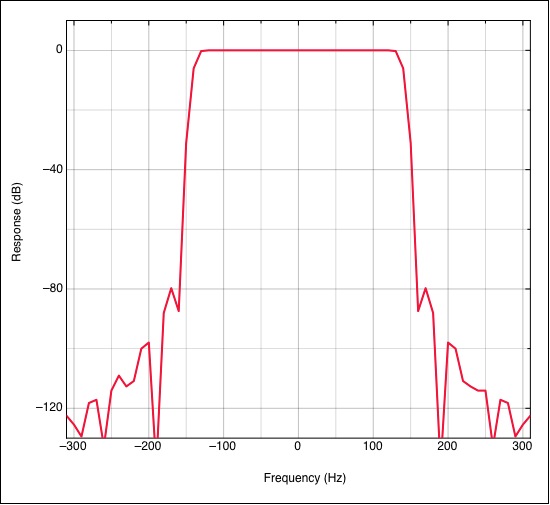
Figure 2.1: Blackman
Windowed Bandpass Filter with bandwidth of 280
Hz
Notice that the response of the filter falls below -100 dB
beyond a 400 Hz bandpass.
Figure 2.2 shows a plot of the Character Error Rate for
20000 characters from a bandpass filtered RTTY signal in
additive white Gaussian noise (AWGN).
An unpublished experimental RTTY modem that has a built-in
Channel Simulator is used to generate data for the plot.
The automatic threshold corrector (ATC) of the demodulator
is turned off since there is no selective fading. The error
rate is plotted against the bandwidth of the filter that is
shown in Figure 2.1 (but for different cutoff frequencies).
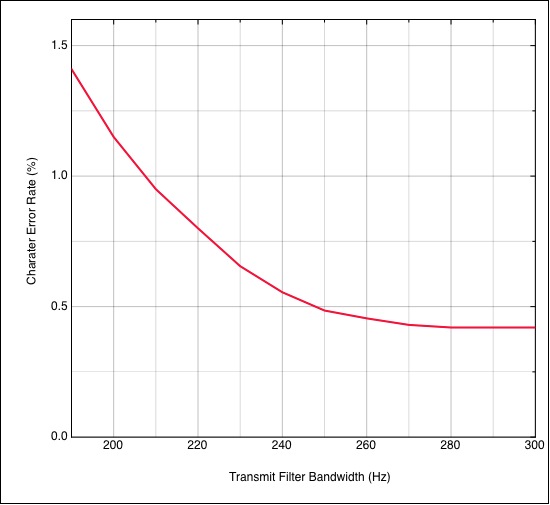
Figure 2.2: Character
Error Rate vs Transmit Filter Bandwidth
The SNR of the RTTY signal is -7 dB (in a 3 kHz noise
bandwidth). The asymptotic error rate on the right of
Figure 2.2 is about 0.42%. Although the plot in Figure 2.2
stops on the left at 190 Hz, the error for a 180 Hz filter
was measured to be 2.4% (6 times more than the error rate
for the wider filters, and represents a SNR loss of almost
one decibel). The error rate rises very steeply
below 190 Hz.
The theoretical Cramér-Rao bound [reference 3] for a 45.45 baud RTTY at
this SNR has a character error rate of about 0.40%
(VE3NEA's "theory" curve [reference 4] shows the bound
drawn as a blue curve in his AWGN plot).
From this, we propose that a properly centered Blackman
windowed transmit bandpass filter that is 270 to 280 Hz
wide, and has the number of taps described above will not
cause additional decoding errors.
The filter can probably be tightened further, but as seen
in Figure 2.1, even a 280 Hz Blackman window provides
better than 100 dB of keying sideband suppression beyond
400 Hz (200 Hz on each side of the center of the RTTY
signal). If channelized, we can comfortably fit RTTY
stations 400 Hz apart when such a filter is used, with 100
dB worth of isolation between stations. The interchannel
isolation is actually about 10 dB better since the first
RTTY keying sideband is about 9 dB lower than the carrier
power. The centers of an S2 station and an S9+50 dB station
can be as close as 400 Hz apart and the S2 station can
still be copied.
A less precise filter (fewer taps per sampling rate, for
example) will need to be a bit wider since the flat top of
the Blackman filter will not extend as wide. Similarly,
some other window shapes may also need other adjustments.
Windows should be chosen, in any case, to ensure that the
filter does not appreciably widen even down to the -80 dB
level.
3. Mark/Space Overlap
Intermodulation distortion is a somewhat unpredictable
quantity between different transmitters. However, for a
moderately well behaved transmitter, each decibel of
increase in power tends to increase the 3rd order
intermodulation components by about 2 dB. Conversely,
reducing the output by a factor of just 1 dB can reduce the
3rd order intermodulation by 2 dB.
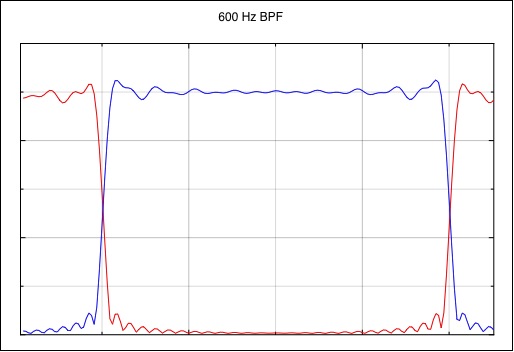
The following figures show the Mark/Space eye pattern of a
filtered RTTY signal (the red curve is the Mark signal and
blue curve is the Space signal). Each 4 horizontal
divisions is equal to one bit period.
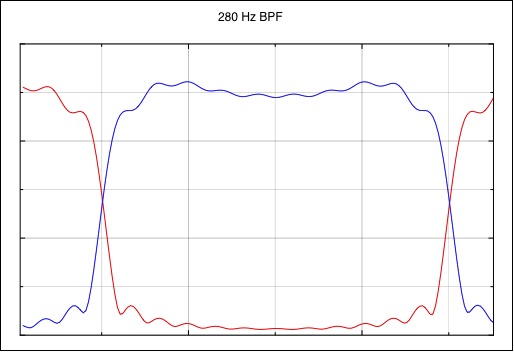
The curves are constructed using two separate OOK tones,
one at the Mark frequency and one at the Space frequency,
and their individual detected responses are plotted. This
is done so that the detector that is used to measure each
tone can have a bandwidth that is wide enough to capture
the true rise and fall times of the filtered RTTY signal.
The detector that produces the above curves has a rise time
of approximately 0.05 msec (a 45.45 baud signal has a bit
period of 22 msec).
Notice that the ringing is not the typical filter ringing
that is commonly seen from a narrow band filter. This is
because the Mark signal is not centered in the transmit
band pass filter; one set of its keying sidebands is
heavily attenuated by the filter while the other set of
keying sideband has an additional distance of 170 Hz before
they are cut off. The Space signal is likewise offset on
the other side of the center of the bandpass filter, with
the complementary set of keying sidebands more attenuated
than the other.
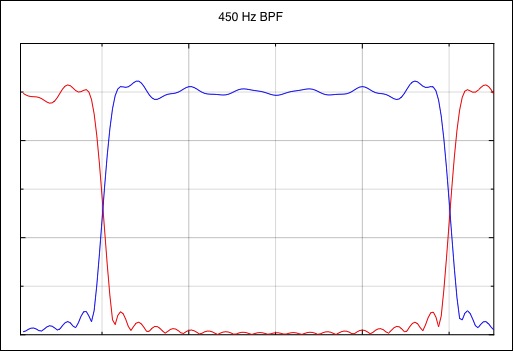
The worst case IMD (maximum power) should occur when the
two components cross at half the maximum level. Due to the
complementary nature of the waveforms, the overlap at other
points in the waveform are always lower.
The amount of IMD that is seen at the output therefore
depends heavily on how long the waveforms "linger" near the
halfway point. As seen in the above 3 plots, the amount of
time spent near the halfway point is inversely proportional
to the filter bandwidth (i.e., the rise time of a pulse is
roughly inversely proportional to the filter bandwidth).
One would therefore expect a 300 Hz filter to have produce
twice the overlap of a 600 Hz filter. Since each dB of
overlap power can amount to 2 dB of IMD, one might expect
the 300 Hz filter to produce between 3 and 6 more dB of IMD
than a 600 Hz filter.
By measuring the IMD that is produced by a given filter
through a transmitter, then using the 3 to 6 dB IMD for
each halving of the filter bandwidth, we can roughly guess
how narrow we can construct a final transmit filter. These
are rough guidelines based upon a "well behaved"
transmitter." The actually IMD will need to be carefully
measured when the bandwidth of the filter is chosen.
4. Conclusion and Observations
It is shown that we can indeed implement practical transmit
RTTY filters that do not cause additional decoding errors,
and at the same time are useful even when channel spacings
of the RTTY signals are very small, and when the dynamic
range of signals is very large (100 dB).
Please note that the transmit filter that is used in
Section 2 is a symmetrical FIR filter and the passband is
perfectly centered on the RTTY signal. This means that the
filtering will maintain the original Mark/Space balance,
and equally important, the filter is linear phase.
Arbitrary transmit filters (for example, analog crystal
filters) will not have a symmetric passband and will
additionally have group delays. To replicate the results in
section 2, the filter must satisfy both of these
conditions. If the filter is not implemented numerically in
DSP (digital signal processing), it should be designed so
that the frequency response is flat within a fraction of a
decibel up to 280 Hz and have minimal group delay between
the Mark position and the Space position. An analog filter
will probably need to be at least 400 Hz to satisfy the
conditions. An analog filter may also not have the 100 dB
ultimate rejection of the digital filter that is shown in
Section 2.
References
- Kok Chen, W7AY, FSK Sidebands, http://www.w7ay.net/site/Technical/RTTY
Sidebands/sidebands.html
- Andy Flowers, K0SM, RTTY Spectrum
Measurement, http://www.frontiernet.net/~aflowers/k3rtty/k3rtty.html
- Cramér-Rao bound, Wikipedia, http://en.wikipedia.org/wiki/Cramér–Rao_bound
- Alex Shovkoplyas, VE3NEA, RTTY Software
Comparison, http://www.dxatlas.com/rttycompare/